Ask any teacher in any discipline at any grade level and they will tell you that literacy is one of their biggest concerns and challenges. What they mean by “literacy” can vary considerably, but generally we can take it to mean successful interpretation of the signs, symbols, and meanings someone else is trying to communicate. Literacy is often used to describe deciphering texts. In a child’s early years, basic phonics is the most common form of literacy, and as students get older, literacy comes to mean understanding the written word in all its variations.
But we often miss the mark by focusing solely on “text-based” literacy. Literacy includes a wider selection of deciphering all the different ways that humans communicate with each other. Literacy includes making sense of images, charts, graphs, timelines, and maps, as well as texts. Indeed, making sense of these varied formats is more important than ever.
Using atlases as a regular part of instruction allows you to access the building blocks for literacy in all these varied domains. Here are six different methods students can use to interpret content from an atlas and build key literacy skills.
1. Images
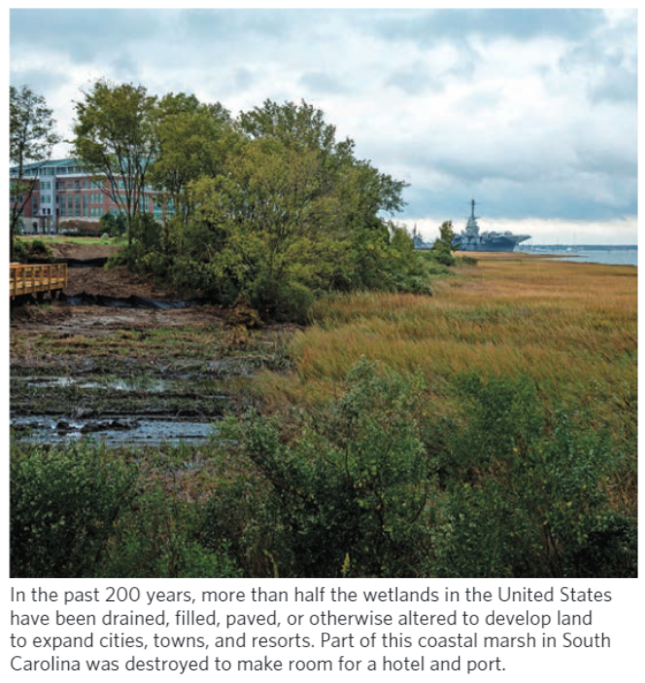
While you can find images in a variety of sources, having students interpret images in an atlas gives them more context clues to figure out what is going on and allows them to develop more sophisticated questions about what it is they don’t understand. Moreover, the use of captions in the atlas provides additional support to help them focus on the content. Ask students to identify what they “see” and what they “wonder” about that image in order to spur them to look closer and develop questions—all a part of image-based literacy.
2. Charts
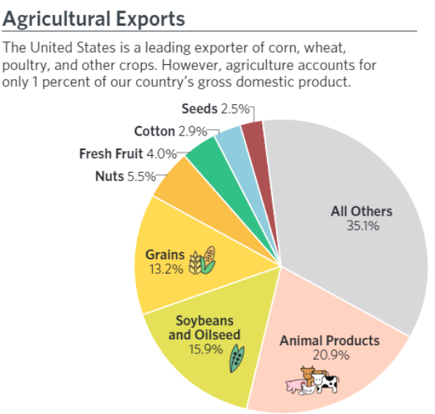 These come in many forms, but at their essence they allow students to compare different types of information. There are pie charts and bar charts, spider charts, and multilevel charts. Each format provides a different way to visualize information (data) and make comparisons to identify similarities and differences. Students need to understand the variables presented, how they relate to one another, and what the chart’s different shapes or colors represent. Charts with numbers and percentages also allow students to demonstrate basic numeric literacy. How a chart is formatted matters as well, since the way in which it presents information can influence a viewer’s interpretation of the data. It is important for students to consider (as with all these other sources) if the author is promoting a specific point of view, what that view is, and how one could one come to a different conclusion if the chart presented the data in a different way.
3. Graphs
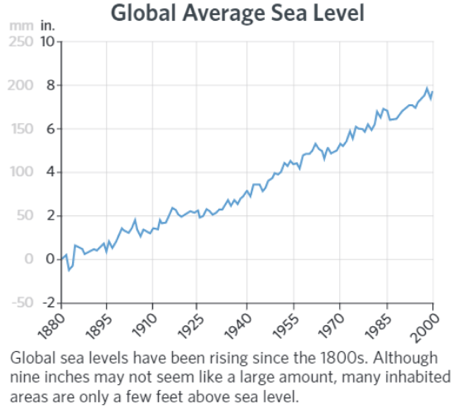 We must ask ourselves (again) if the author has a point of view, what they are trying to communicate with this information, and what the data would it look like if we graphed another way. For example, in this chart of Average Sea Level, if you change the X axis so that each square represents one inch instead of two, the line tracing the changes will seem much steeper, and therefore might lead one to conclude that the change is more severe.Graphs are like charts (and the terms are sometimes used interchangeably), but in their most basic form graphs have both an X and Y axis as a way of comparing two things in a quantitative manner. Understanding what the X and Y axes represent is the key to understanding the graph. Students must also look at scale to understand the magnitude of what is being compared. Playing with scale allows am author to make small differences seem large or large differences seem small, so, it is critical to ask what the graph would look like if the variables on one of the axes changed?
4. Timelines
Sequencing is an essential skill. Students need to understand what happened and in what order. It is the basis for understanding cause and effect, and without that basic skill under our belt we are doomed to a life of missteps and failures. Timelines can be crucial to the study of history, and if we are to understand anything about the past that will help us in the present (and the future) we need to master timelines. What happened, when, and what followed from that?
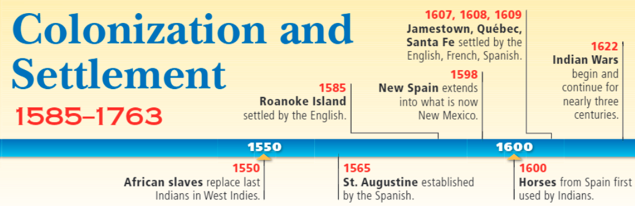
Timelines don’t necessarily tell us what caused the next entry on the timeline, but they do allow us to engage, question, speculate, and research the links between one event and then next. Not every event that happened gets entered on the timeline—so why were the events on this timeline chosen rather than others? Students should be encouraged to explore, question, and rewrite timelines in ways that are meaningful to them. Timelines often include an unstated bias or point of view which links one event to the next. Can your students uncover those hidden assumptions? How can changing the beginning and end dates on intervals on a timeline affect how one might interpret cause and effect?
5. Maps
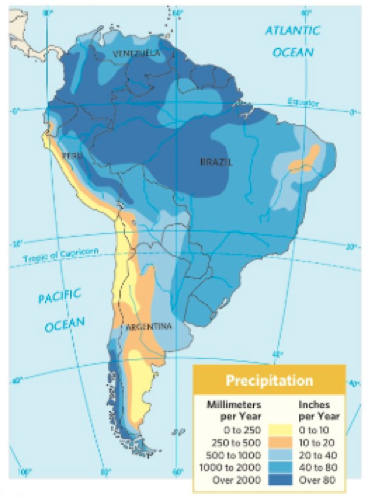 Atlases also often include maps (surprise)! Map reading skills are critical for navigating the world around us. Students need to understand what a map represents, and how it uses the interplay of scale, perspective, color, and lines to create a representation of the physical world. There are so many different types of maps: thematic, physical, political, sculptural relief, topographic, road maps, trail maps—the list is almost endless. Students need to understand what maps can answer about the questions they need to solve. For example, it would not be helpful to use a topographic map to figure out how to drive from downtown to the beach, or to use a weather map to figure out where to drill an oil well. While many maps appear to represent the natural world as it is, students need to be reminded that maps are made up of human-generated conventions, symbols, and projections, and can thus show bias.
6. Short Texts
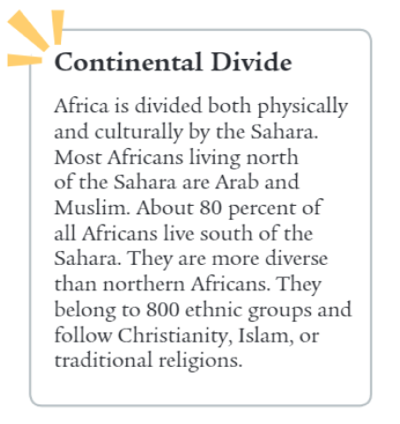 For those of you who want a more traditional focus on literacy, atlases also offer students the chance to engage with deciphering and interpreting the written word. Selections are usually short and to the point, and most states have standards that students need to demonstrate proficiency with informational texts. Your atlas is the perfect place to look for that informational content. Divided into bite-size chunks, passages are easily digestible for students and offer excellent content for close-reading activities. For example, have students rewrite a passage in their own words, identify its main idea and supporting evidence, or make connections between the text and their own experiences. They can also relate one selection of text to another and consider how the selections are connected, if the sum of their ideas adds up to more than they do individually, and if there are other examples of the same idea conveyed in the text in other parts of the atlas. Have students engage with any vocabulary that might be new to them. Can they identify synonyms or antonyms to help them understand the context and meaning of these new terms?
For those of you interested in promoting student literacy, get out your atlas and give your students a reason to explore. It will better prepare them to question, evaluate, and make sense of the world around them.
Nystrom digital maps and atlases can enhance geographic literacy skills with hands-on activities
Try a free 30-day trial today
Dr. Aaron Willis is the Chief Learning Officer (CLO) for Social Studies School Service, where he has worked in the field of interactive and digital education for more than two decades. His primary areas of interest include brain-based imaging, hands-on learning, and evidence-based reading and writing strategies. Dr. Willis oversees the development of Active Classroom and Nystrom World with an eye toward implementing the latest pedagogic strategies in a manner that is intuitive and easy to use for both teachers and students. Based in Los Angeles, California, he travels frequently to work with teachers, focusing on practical solutions to their professional challenges.